Fruit Quality from NIR Spectra
Beyond the Visible: Near-Infrared Spectroscopy and its Application to Fruit Quality Assessment Through Deep Learning
Ariel Fishgang — PXR · Rouse Award: Essay, Chemistry and Computer Science · Supervisor: Dr Denes · Word count: 3855
Abstract
In recent history, image recognition has exploded, primarily using information within the visible spectrum. Using other parts of the electromagnetic spectrum has only started to be developed. Near-infrared (NIR) spectroscopy is a well-known and heavily researched non-destructive technique to gain unique sample information. With the technology already available to collect NIR data, the next step is fully utilising it, which can be achieved with chemometric techniques and deep learning. The fact that NIR spectroscopy can discover information that otherwise would not be possible to access without physically changing the sample creates unique applications in many different industries, such as pharmacy, medicine, and agriculture. Due to the increased emphasis on sustainability, the most significant uses of NIR spectroscopy are in the agricultural sector. The essay discusses the use of NIR spectroscopy combined with deep learning models in fruit quality assessment. As results suggest, despite the huge progress in the field during the last few years, more research is required to develop a generalised model to help interpret NIR data from different fruit species.
1. Introduction
Since the first infrared emission spectrum was measured in 1881 [1], Near-infrared (NIR) has been overlooked and not studied for its apparent simplicity. However, with new analytical techniques, smaller infrared spectrometers, and a better understanding of deep learning, we can now extract and utilise NIR's complete information with the help of deep learning tools.
NIR spectroscopy is gaining popularity as a non-destructive analysis method in a number of industries (pharmaceutical, medical, and agriculture), leading to a number of applications. This essay discusses three applications of NIR spectroscopy in detail: imaging during the pharmaceutical process [2], measuring muscle oxygenation [3], and assessing biochemical content and quality in food and agricultural processes [4]. The essay then focuses on the specific use of NIR spectroscopy in quality control in the agricultural industry. Fruit quality can be evaluated pre- and post-harvest, with methodologies analysing physical attributes and assessing physiological indicators [5]. Another indicator of fruit quality is the dry matter (DM) content of different fruits and vegetables, which is the percentage of matter without water within the produce. Using deep learning, the DM content of samples can be extrapolated from their respective NIR spectra [6]. Mishra and Passos claim to have created a global model for this task [6]. This claim is tested through external datasets and attempted to be optimised in the essay's final section.
Quality control of fresh produce generates unnecessary waste, takes time, and is sometimes labour-intensive. Proposing a method that solves all these problems would significantly affect the agricultural industry and beyond, impacting many more sectors than just fresh produce.
2. Background and Related Work
Infrared spectroscopy (IRS) is a chemical instrumental method that uses the fact that when a molecule absorbs infrared waves, each bond vibrates with a unique frequency of stretching or bending. The energy each bond absorbs depends on its bond length and strength, and the atoms' mass. This leads to unique spectra of the absorption of each wavelength in the infrared (IR) range, 2500–50,000 nm [1], to be constructed and used to identify different organic substances.
The electromagnetic spectrum is split up into seven major regions dependent on the wavelength and frequency of the waves with it, with some ranges being separated further (Fig. 1). The mid-infrared region from 8500 nm to 12,500 nm [1], which has the greatest density of absorption bands and, therefore, allows pairs of almost identical molecules to be differentiated, is known as the fingerprint region. Provided that a chemist has reference spectrums, unknown pure compounds can be identified through comparisons [7].
Near-infrared spectroscopy (NIRS) differs from IRS in the analysed IR range. The electromagnetic spectrum is shown in Fig. 1. The NIR range contains much shorter wavelengths, which results in three major differences in the process. (1) Sample preparation: Since NIR light is absorbed less strongly than IR light, sample handling is not required for NIRS, but sample preparation is required to eliminate the spectrometer's saturation in IRS. (2) Identification: although identifying molecules is much more complicated in NIRS than in IRS, it allows for quantifying chemical and physical properties. (3) Sample type: NIRS can examine heterogeneous samples due to its extended penetration depth compared to IRS [8].
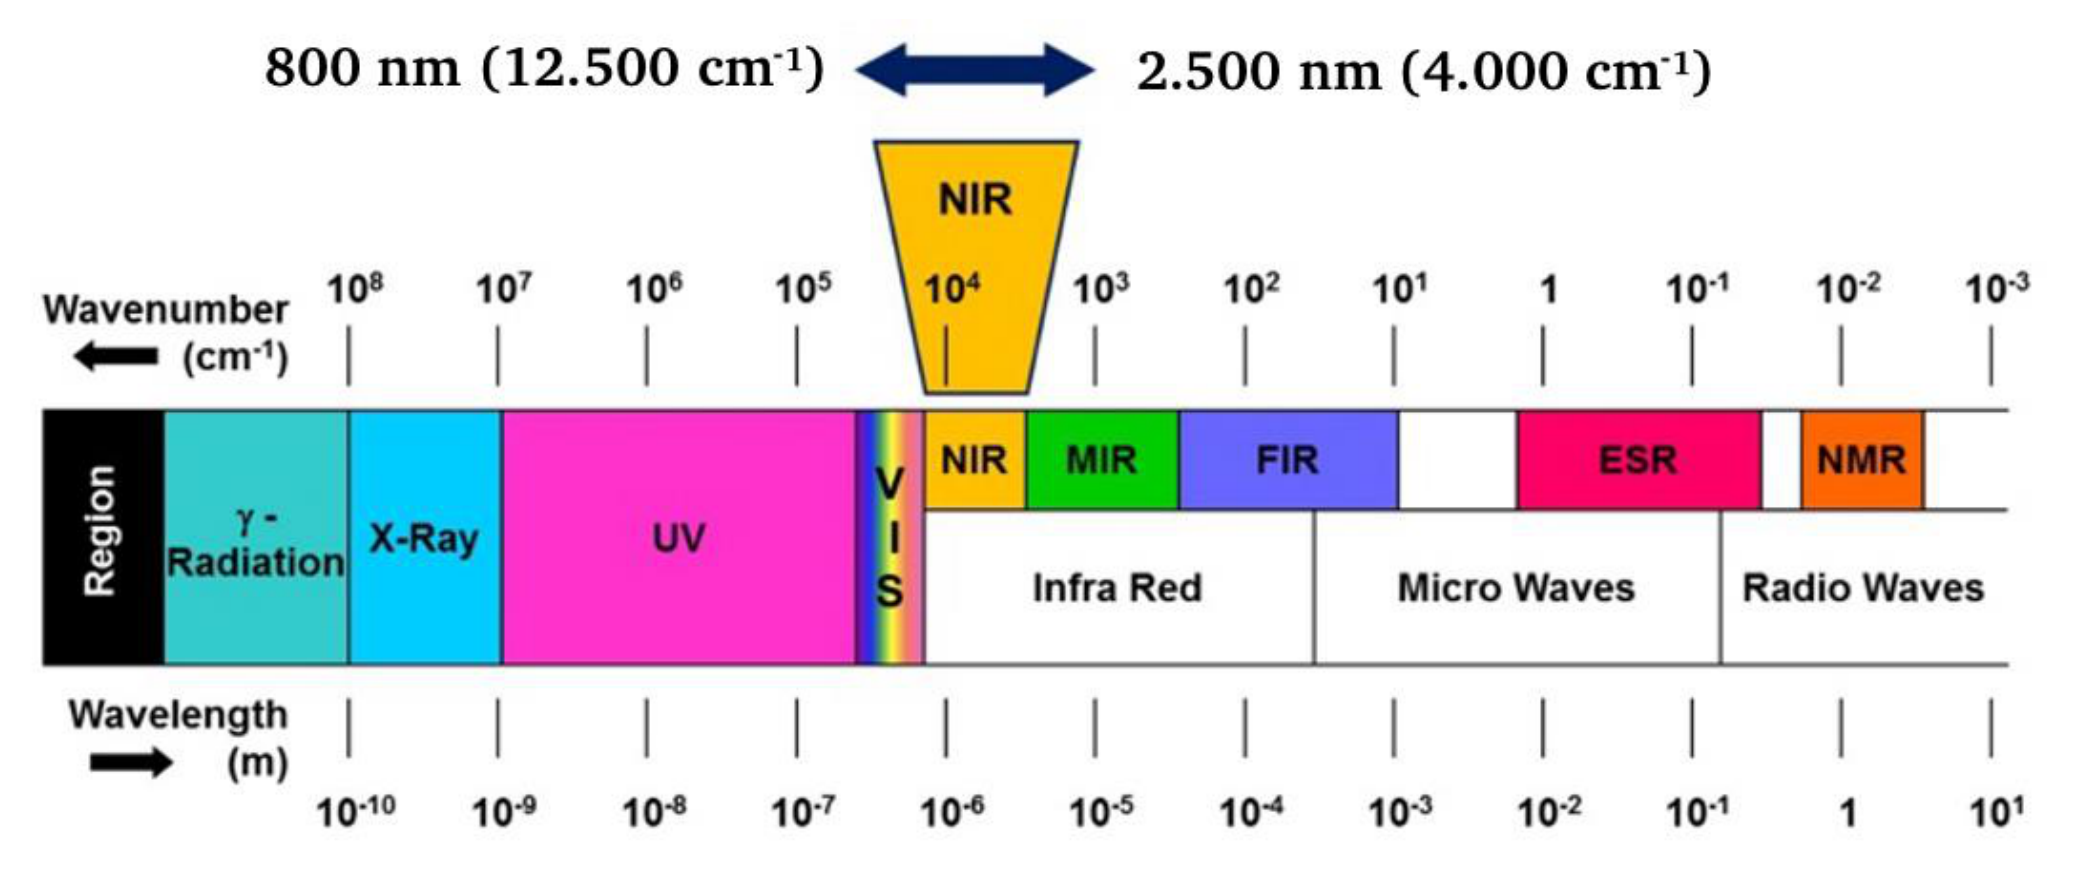
Figure 1. A graphical representation of the separate regions of the electromagnetic spectrum highlighting the IR range. Adapted from Bruker [9].
Despite the NIR region only containing a few broad peaks (Fig. 2), quantum mechanics complicates the information stored behind the apparent simplicity. Because quantum mechanics does not restrict the vibration of chemical bonds to two states, there are two absorption processes: overtones and combinations. Overtones can be compared to harmonics, integer multiples of the fundamental frequency of the absorption. NIR absorptions require more energy than fundamental absorptions because the absorptions are at a higher "excited" state. Combinations occur when multiple fundamental absorptions overlap. Many combinations will occur in an NIR spectrum because only a few overtones are possible. When these overlap, the spectrum looks simple, with a few broad peaks despite the complexity of overtones and combinations. With the use of computers and further developed instruments by Karl Norris in the 1980s, NIR was proven to be a valid tool for quantitative analysis by breaking down how each peak forms [1]. For further developments of NIR, the instrumentation had to get smaller to allow for more diverse uses.
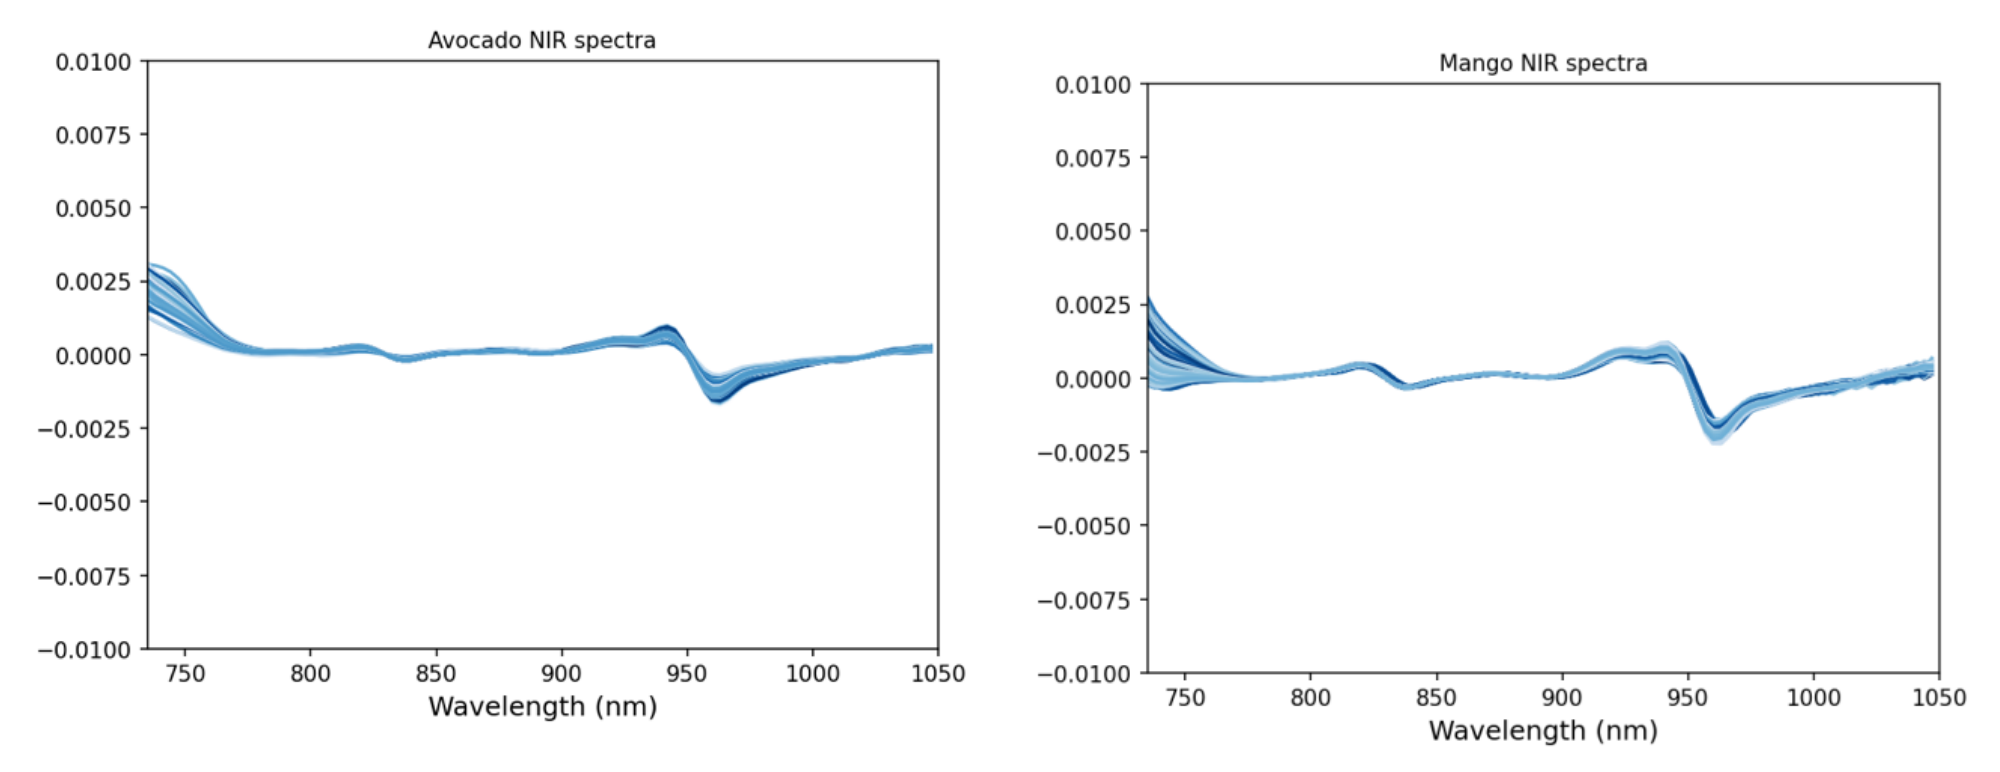
Figure 2. NIR spectra of avocado (left) and mango (right) datasets used in this study after normalisation, showcasing their similarity.
3. Applications of Near-Infrared Spectroscopy
3.1. Pharmaceutical Chemical Imaging
There are two primary uses of NIR in the pharmaceutical industry: evaluating homogeneity and estimating analyte concentration [2]. Amigo et al. provide a comprehensive review of different chemometric techniques for analysing pharmaceutical samples using NIR, during the blending stage of production [2]. Chemometrics is the science of relating the measurements made on a chemical system to the system's state via mathematical or statistical algorithms [9]. Food and drug administrations require that pharmaceutical blends and powders be blended uniformly, so the importance of accurate analysis of this property is evident [10]. Storme-Paris et al. conducted a study evaluating the homogeneity of complex powder blends of drugs for patients undergoing bone marrow transplants. Homogeneity is vital in this context to maintain constant drug delivery. After analysis of the NIR data collected from the blend of fourteen different formulations using qualitative and quantitative chemometric techniques, Storme-Paris et al. have shown that NIRS proved an effective method for "characterising, optimising, and controlling" the mixing process [11].
NIR data can also be acquired by near-infrared chemical imaging (NIR-CI), which captures a great deal of information non-invasively. The NIR spectrum is stored for each image pixel, creating a complex hyperspectral dataset and making it an essential tool in the industry [2]. Several techniques have been developed to estimate the analyte concentration in each image pixel. Classical Least Squares is preferred because it does not require calibration and allows fast analysis. Since NIR-CI stores the position of each spectrum, the concentration of analytes can be estimated throughout the sample, enabling a helpful, non-invasive way of information extraction [2].
3.2. Measuring Muscle Oxygenation
Muscle oxygenation describes the amount of oxygen the muscle receives. In addition to being necessary for everyday function and intense physical activity, muscle oxygenation can be used to research muscle activity during exercise, determine critical power output, and assess other attributes of a person's physiology [12, 13].
NIRS is the most common non-invasive methodology for measuring muscle oxygenation. Hamaoka et al. focus on how NIRS allows measurements of skeletal muscle, which strongly determines oxidative metabolism [3]. During physical exercise, skeletal muscle O₂ consumption (VO₂) can rise to 50-fold, thereafter increasing O₂ delivery (DO₂) up to 10-fold. Any VO₂ or DO₂ impairments of skeletal muscle significantly negatively affect physical performance. The relative changes to oxyhaemoglobin (O₂Hb), deoxyhaemoglobin (HHb), and total haemoglobin (tHb) are most commonly determined to measure oxygenation. Hamaoka et al. also reported studies of diverse muscle groups using this technique, such as the back extensor muscles, trapezius, deltoid, and triceps.
Ichimura et al. [14] conducted a study to research how age and activity status influence muscle reoxygenation time after maximal cycling exercise. The authors used NIR continuous wave spectroscopy (NIRCWS; HEO-200 Omron Japan) to measure O₂Hb during training and the recovery phase. The Hb measured by the NIRCWS can be expressed as a mathematical equation using Fick's law, which suggests that faster Hb recovery measured by the spectrometers should result in a faster recovery of VO₂ or a higher DO₂. This study shows the capability of NIRS, paired with mathematical models, to be a non-invasive, accurate and practical methodology for collecting information about muscles directly.
3.3. Agricultural and foodstuff applications
NIR spectroscopy has many applications in the agricultural and food industries. Hashimoto reviewed this technology and discussed its applications to agricultural fields, food processes, and the concept of a tasting robot [15].
Both Hashimoto and Jamshidi et al. discussed a NIR spectroscopic system to monitor pesticide residue in agricultural products [16]. Hashimoto's review described using mid-infrared (MIR) spectroscopy to detect different pesticides. Jamshidi, on the other hand, focused on developing a Vis/NIR system in combination with the usage of the visible spectrum and chemometrics to determine pesticide residues and classify cucumbers based on the acceptable pesticide limit.
Typically, as described by Jamshidi, the detection of pesticides requires sample treatment using different methods, such as solid-phase extraction and many types of chromatography [16]. These methods have countless disadvantages, including being "destructive," "time-consuming," "very expensive," and "environmentally unfriendly." The most prospective solution to this problem is NIR spectroscopy, which is non-destructive and inexpensive. Due to its fast nature and lack of necessity for sample preparation, it can be applied to processing lines directly. Jamshidi concluded that a spectroscopic system operating in the Vis/NIR range, paired with user-friendly software, is fast, non-destructive, and reliable. These designed systems have the potential to distinguish between safe and unsafe fruit samples based on their pesticide residue [17].
4. Fruit Dry Matter Content Prediction with Deep Learning Analysis
4.1. Deep Learning
Like most analytical techniques, the data obtained from the NIR instrumentation is raw and cannot be directly used to obtain specific information about the sample. In the past, the primary method was chemometrics. This is relatively simple compared to artificial intelligence (AI), which can compute more complex dependencies from the spectra. As artificial intelligence becomes able to calculate more advanced relationships, deep learning will likely take over as the leading way to use spectral data. As LeCun summarises [18], deep learning has allowed computer systems and AI to "learn" representations of data with multiple levels of abstraction and find intricate structures within large data representations [18].
4.1.1. Convolutional Neural Networks
Artificial neural networks (ANNs) are inspired by the function of the human brain. They consist of interconnected nodes known as artificial neurons, which process received information and transfer it to the neurons in the next layer [18, 19] (Fig. 3). Convolutional neural networks are a type of ANN used in image recognition and signal analysis. Convolutional neural networks (CNNs) are used in NIR spectroscopy because of their ability of multiple attribute prediction, interpretation and the use of multiple inputs [20]. O'Shea and Nash explain that CNNs are similar to traditional ANNs because they are both made up of neurons, which can be optimised through a learning process [21]. CNNs are predominantly used in pattern recognition within images, so their architectures are set up to handle this data type and reduce the overall number of parameters (such as weights and biases) in a CNN.
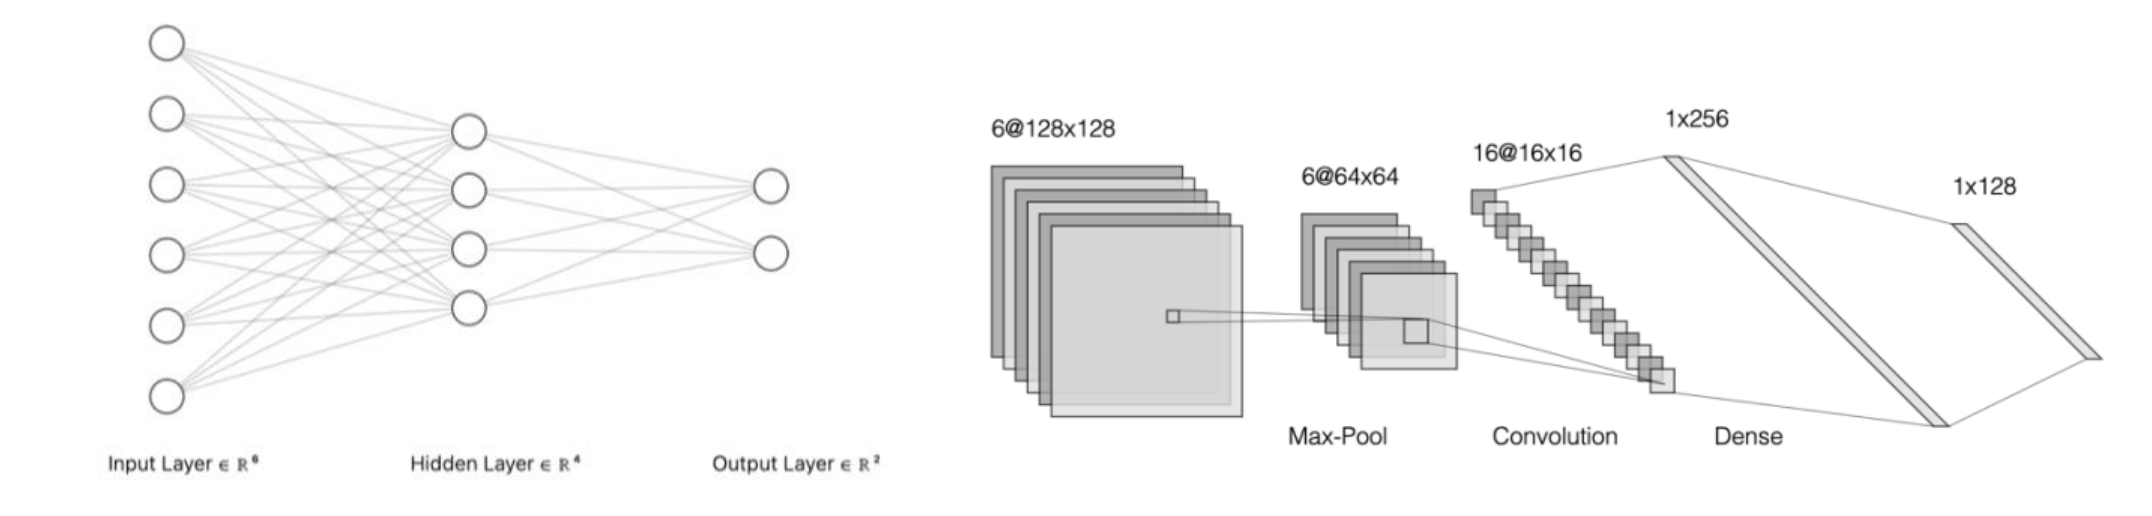
Figure 3. ANN versus CNN: Examples of the differing architectures of an artificial neural network (left) and a convolutional neural network (right). Adapted from Alex Lenail [22].
CNNs consist of three types of layers: convolutional layers, pooling layers, and fully connected layers (Fig. 3). The convolutional layer transforms its input data into a 2D activation map through many kernels, reducing the size of the network and preventing it from becoming too computationally complex [21]. The pooling layer aims to minimise the CNN's complexity by scaling the dimensionality of each activation map. The fully connected layer simply contains neurons that are connected to neurons within the two adjacent layers but are not connected to the layers themselves. All these reductions in complexity result in faster training in CNN compared to traditional ANNs.
4.2. Dry matter content prediction from NIR spectra
Since the 1850s, approximately one billion hectares of forest have been converted into farmland, which notably continues to degrade the land and freshwater surrounding it [23]. As the emphasis on sustainability and protecting the planet has increased dramatically in the last twenty years, the agricultural industry (as well as others) has had to adapt its current methods and create new, more environmentally friendly techniques.
Quality control involves the identification and evaluation of any defects that can harm the freshness, safety, or nutritional value of the product in the supply chain of fresh produce. One indicator of fruit quality is its dry matter (DM) content [24]. However, obtaining dry matter content is difficult, destructive, and time-consuming, which makes this method of determining quality unfavoured in the industry. One particular approach for solving this problem is using NIR spectroscopy, paired with deep learning, to predict the DM content of a sample. As discussed throughout this paper, NIR spectroscopy is non-destructive and requires little to no sample preparation, making it ideal for use in the agricultural industry.
There are no current universal models for predicting the DM content in fruits or vegetables. Instead, the models that have been created so far are specific to the fruit/vegetable species, cultivar, and origins [6]. Passos claimed to have developed a global model that can identify the DM content in fruit after testing a few different statistical approaches and multiple optimised CNN models [6]. A global model is global across any fruit species inputted into it and across any data of the same species the model has been trained on.
The following section reviews the generalisation of the model by testing it on internal and external datasets and aims to improve it by pre-training with different datasets.
The code used in this work can be found at: https://github.com/ArielFishmongers/Rouse-POC.
4.2.1. Materials and Methods
For any further developments in analysing DM in the future, the code and results must be reproducible in local environments. The code downloaded directly from Passos' GitHub directory [6] needed changes to run fully. The main issue with the code was setting up the environment to run code locally. In my adaptation of the code, I have chosen to use an isolated environment approach using Conda rather than pip to handle dependencies in a better way. The instructions for setting up the Conda environment can be found in my git repository: https://github.com/ArielFishmongers/Rouse-POC.
All datasets used in this study have been downloaded from the following GitHub directory [6]. Each dataset was pre-processed and scaled as described by Passos et al. [6]. Each individual fruit dataset was randomly split into train and test sets, 80% and 20%, respectively. The distribution of the data is summarised in Table 1. The data was consequently combined into monolithic train and holdout test sets [6].
The CNN-R_v1E model from Passos was chosen to be used in this work in all runs, as it showed the best performance in DM prediction based on NIR spectra in the original paper [6].
| Fruit | Samples in train set (n = 2861) | Samples in test set (n = 716) | Dry matter (%), mean ± std |
|---|---|---|---|
| Apple | 1124 | 281 | 15.499 ± 1.576 |
| Kiwi | 438 | 110 | 15.644 ± 3.336 |
| Mango | 580 | 145 | 14.901 ± 2.006 |
| Pear | 255 | 64 | 14.757 ± 1.810 |
| Avocado | 464 | 116 | 21.823 ± 3.296 |
Table 1. Overview of the number of fruit samples in different train and test datasets.
To test if the results in the original paper [6] could be reproduced, I chose to compare the root mean square error (RMSE) of the models during the hyperparameter optimisation (HPO) procedure, as this shows the performance of each model during its fine-tuning. RMSE provides a measure of how accurate each prediction is, giving a representation of how well the model is able to predict DM content as the hyperparameters are tweaked during optimisation. Another performance metric is the R² value, which measures data linearity [25]. RMSE and an R² value were used to determine the model's performance on this dataset. All reported error values are in the same units as the DM data (i.e., DM %).
4.2.2. Results
4.2.2.1. Reproducing the original results
I first trained and tested the CNN-R_v1E model using the same datasets and hyperparameters as described by Passos [6] to validate the reproducibility of the code in my local environment. The model was trained on an original multi-fruit dataset containing apple, kiwi, mango, and pear data and tested on a test dataset containing data from the same fruits. Importantly, the data split into training and test datasets was preserved by using the same seed as described in Materials and Methods and in https://github.com/ArielFishmongers/Rouse-POC. The metrics of the model performance are summarised in Table 2. This experiment setup produced similar results to those in the original paper [6] (R² = 0.916 & RMSE = 0.619 ± 0.007 vs R² = 0.917 & RMSE = 0.614 ± 0.011, here and in [6], respectively), and suggests that there were no technical problems in the code.
4.2.2.2. Testing the generalisations of the multi-fruit deep learning model across fruit species
The first aim of the study was to test whether the model created by Passos was global across any fruit species, as the paper claims [6]. To test it, I have chosen to use a new dataset containing avocado data [26]. The data was pre-processed and split into training and test datasets (80% and 20%, respectively) as described in [6] and the materials and methods section. The CNN-R_v1E model was trained on the full multi-fruit dataset and used the multi-fruit holdout test set as a validation split to tweak the regularisation strength [6]. As described by Passos, the optimisation was done using 5-fold cross-validation [6]. The final prediction step has been done on the avocado test data, and metrics are summarised in Table 2.
Unexpectedly, the model displayed poor performance on this test dataset, showing abnormal values of R² and RMSE, -3.191 and 6.897 ± 0.064, respectively (Table 2). Negative and/or above 1 values of R² indicate that the model performed worse than a function that always predicts the mean of the data. As RMSE here is more than two standard deviations above the value representing anticipated metrics calculated in 4.2.2.1 and in [6] (0.614 ± 0.011), these results imply that CNN-R_v1E is, in fact, not global across any fruit species, as claimed before in Ref [6].
4.2.2.3. Pre-training the model with the new dataset does not improve the performance of the multi-fruit deep learning model
After obtaining negative results in predicting the DM of avocados using the published model (CNN-R_v1E), I attempted to improve the model's predictive power. I explored the addition of new species to the training set in an attempt to improve the accuracy of the model's results by pre-training it with a combined dataset containing previously published and avocado datasets.
The avocado data was randomly split into training and test datasets as in 4.2.2.2 and combined with the rest of the fruit data into train and test splits (multi-fruit & avocado datasets in Table 2). This training split was combined with the original datasets, including apple, kiwi, mango and pear data, to create a new full dataset. The pie chart describing the distribution of the data coming from different fruits in the original dataset published and the full combined dataset is shown in Fig. 4. As is seen from Fig. 4, the avocado dataset occupied around 16% of all data.
The model was then retrained and re-evaluated on the avocado-only test split. This gave RMSE and R² values similar to the test described in 4.2.2.2 (R² = -2.464 & RMSE = 6.270 ± 0.106 here vs R² = -3.191 & RMSE = 6.897 ± 0.064). Table 2 summarises the results of all runs. These results signify that the model's pre-training did not improve its performance and, therefore, did not help create a global model predicting DM based on NIR spectra.
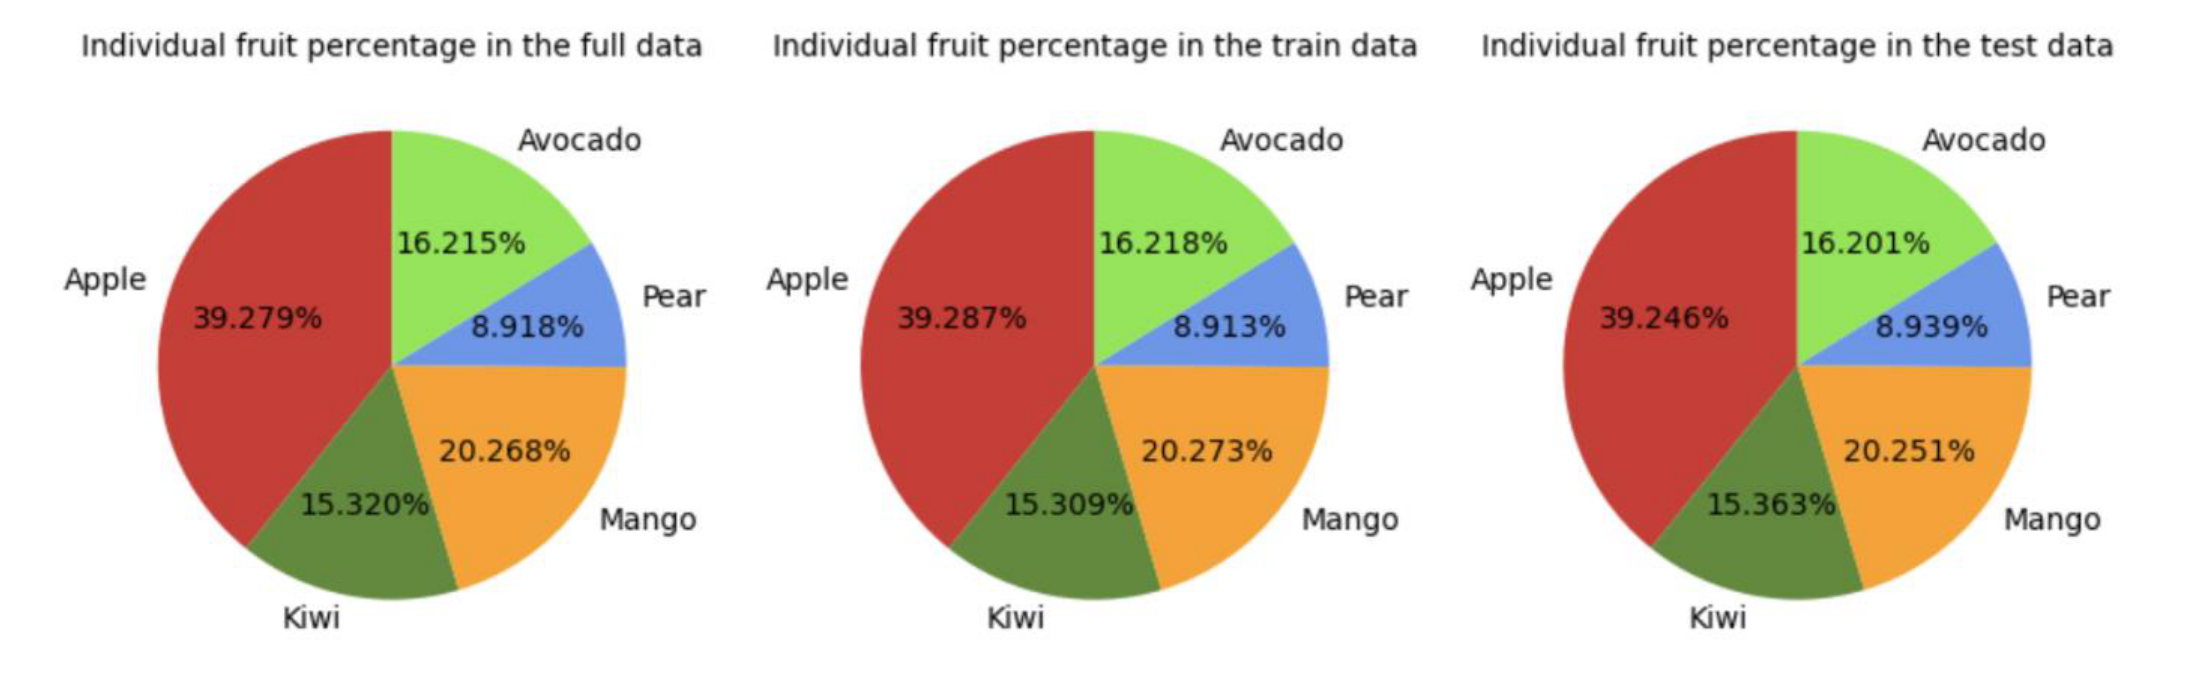
Figure 4. A pie chart showing the distribution of fruit samples in the full, training, and testing datasets.
4.2.2.4. Attempt to improve the multi-fruit deep learning model and to investigate reasons for poor performance
Results described in 4.2.2.3 indicate that the Passos article's claim that the model is global and can be applied to any species [6] couldn't be confirmed. One possible explanation for the results described in 4.2.2.2 and 4.2.2.3 is that the model performs well only on a varied, mixed fruit dataset and fails to perform well on individual fruit datasets. To analyse this hypothesis, I retrained the model on the multi-fruit and avocado dataset (apple, kiwi, mango, pear, and avocado data) and tested it on a full testing dataset containing the same diversity of fruits. The split between train and test data was kept the same as before: 80% and 20%, respectively.
Surprisingly, this run yielded performance comparable to the results published in the paper [6] (R² = 0.949 & RMSE = 0.781 ± 0.010 vs R² = 0.917 & RMSE = 0.614 ± 0.011, here and in Ref [6], respectively). Results from all the runs are summarised in Table 2.
This data, together with the results of the paper [6], suggests that the test data should capture the same diversity in the test dataset as in the training data in order to accurately predict DM based on NIR spectra. This further indicates that the CNN architecture presented by Passos in the paper [6] can be used across all fruits; however, the parameters should be tuned to individual fruits rather than being used as global parameters.
| Run | Training dataset | Testing dataset | Train R² | Train RMSE ± std | Test R² | Test RMSE ± std |
|---|---|---|---|---|---|---|
| 1 | Multi-fruit | Multi-fruit | 0.921 | 0.604 ± 0.006 | 0.916 | 0.619 ± 0.007 |
| 2 | Multi-fruit | Avocado | 0.921 | 0.604 ± 0.006 | -3.191 | 6.897 ± 0.064 |
| 3 | Multi-fruit & Avocado | Avocado | 0.950 | 0.753 ± 0.010 | -2.464 | 6.270 ± 0.106 |
| 4 | Multi-fruit & Avocado | Multi-fruit & Avocado | 0.950 | 0.753 ± 0.010 | 0.949 | 0.781 ± 0.010 |
| 5 | Multi-fruit & Avocado | Apple | 0.950 | 0.753 ± 0.010 | -3.690 | 3.295 ± 0.392 |
| 6 | Multi-fruit & Avocado | Kiwi | 0.950 | 0.753 ± 0.010 | 0.534 | 2.257 ± 0.215 |
| 7 | Multi-fruit & Avocado | Mango | 0.950 | 0.753 ± 0.010 | -0.184 | 2.097 ± 0.223 |
| 8 | Multi-fruit & Avocado | Pear | 0.950 | 0.753 ± 0.010 | -0.780 | 2.230 ± 0.244 |
Table 2. Error metrics are presented in % DM for the optimised CNN-R_v1E. The reported values are the average of 10 individual models (each trained using a shuffled train set), giving the mean and standard deviation of the RMSE. The multi-fruit dataset contains apple, kiwi, mango, and pear data, whereas the multi-fruit & avocado dataset contains apple, kiwi, mango, pear, and avocado data.
To further experiment with these hypotheses, I looked at whether the pre-trained model with the full (multi-fruit & avocado) training dataset, as described above, can predict the DM of individual fruits from the full dataset. None of the tests using individual fruit test datasets provided reasonable R² & RMSE metrics compared with performance on full test data, suggesting that the diversity of the training and testing data should be uniform.
5. Conclusions and Final Remarks
As shown previously, the potential uses of NIR are starting to be utilised in diverse applications, providing further knowledge of how to best use this technology. The main advancements with this technique will likely come in advancing the chemometric and deep learning analysis of the data collected by the spectrometers. This is seen in the three applications discussed. In the pharmaceutical industry, NIR spectra of pharmaceutical blends were analysed with partial and classical least square algorithms [2]. In the medical industry, a simple mathematical model was able to predict muscle haemoglobin levels [3]. Finally, in the agricultural industry, deep learning can be used to enhance the predictive capabilities of this technology in the form of a food-tasting robot to detect the presence of pesticides in vegetables [15].
With global awareness of the negative environmental impact caused by humans, the agricultural industry, especially, has had to adapt positively. Dry matter (DM) content is a destructive quality control method in this sector and has shown promise to become non-destructive with the assistance of deep learning. The largest challenge to this methodology is the fact that there is no singular model which can be applied to any fruit. This limits the usage of this technique as additional analysis is required for useful results. On the other hand, the apparent increase in the use of deep learning to predict the DM content of diverse fruit species could be highly influential for the global market and create a global model.
From my tests of the claim in the paper "Deep Tutti Frutti" [6], it appears that the model is not quite there in terms of global applicability. Despite the architecture of the CNN appearing to be correct and applicable for individual fruits, the hyperparameters need to be fine-tuned for each specific fruit. The results I have collected even suggest that there is a disadvantage of using this model if it is retrained on mixed data, since the main use case is likely to only require test data originating from a unique crop and not from a mixture.
I have found a few points of improvement in the experimental procedure proposed by Passos et al. [6] that should be questioned and explored further in the future. The derivation of the train and test splits may affect the validity of the calculated results as it can lead to bias within the model. This was not explored in the original paper [6] or in this research and should be explored further as the splits were maintained throughout the process. In a secondary paper exploring the construction of the original model by Passos, the dataset splits were discussed [27]. Additionally, the hyperparameters were not optimised for every trial for this study, and therefore, this can be explored further. However, if the model is to be truly global, then the hyperparameters should remain constant.
6. References
- 'An introduction to near infrared (NIR) spectroscopy | IM Publications Open'. Accessed: Apr. 19, 2024. [Online]. Available: https://www.impopen.com/introduction-near-infrared-nir-spectroscopy
- J. M. Amigo, J. Cruz, M. Bautista, S. Maspoch, J. Coello, and M. Blanco, 'Study of pharmaceutical samples by NIR chemical-image and multivariate analysis', TrAC Trends in Analytical Chemistry, vol. 27, no. 8, pp. 696–713, Sep. 2008, doi: 10.1016/j.trac.2008.05.010.
- T. Hamaoka, K. K. McCully, V. Quaresima, K. Yamamoto, and B. Chance, 'Near-infrared spectroscopy/imaging for monitoring muscle oxygenation and oxidative metabolism in healthy and diseased humans', J. Biomed. Opt., vol. 12, no. 6, p. 062105, 2007, doi: 10.1117/1.2805437.
- A. Hashimoto and T. Kameoka, 'Applications of Infrared Spectroscopy to Biochemical, Food, and Agricultural Processes', Applied Spectroscopy Reviews, vol. 43, pp. 416–451, Jul. 2008, doi: 10.1080/05704920802108131.
- C. Ziv and E. Fallik, 'Postharvest Storage Techniques and Quality Evaluation of Fruits and Vegetables for Reducing Food Loss', Agronomy, vol. 11, no. 6, p. 1133, Jun. 2021, doi: 10.3390/agronomy11061133.
- D. Passos and P. Mishra, 'Deep Tutti Frutti: Exploring CNN architectures for dry matter prediction in fruit from multi-fruit near-infrared spectra', Chemometrics and Intelligent Laboratory Systems, vol. 243, p. 105023, Dec. 2023, doi: 10.1016/j.chemolab.2023.105023.
- 'Infrared (IR) spectroscopy', RSC Education. Accessed: Apr. 17, 2024. [Online]. Available: https://edu.rsc.org/resources/infrared-ir-spectroscopy/4010243.article
- 'NIR vs IR: What is the difference?' Accessed: May 12, 2024. [Online]. Available: https://www.metrohm.com/en/discover/blog/2024/nir-vs-ir.html
- K. H. Esbensen and L. P. Julius, '4.01 - Representative Sampling, Data Quality, Validation – A Necessary Trinity in Chemometrics', in Comprehensive Chemometrics, S. D. Brown, R. Tauler, and B. Walczak, Eds., Oxford: Elsevier, 2009, pp. 1–20. doi: 10.1016/B978-044452701-1.00088-0.
- A. S. El-Hagrasy, H. R. Morris, F. D'Amico, R. A. Lodder, and J. K. Drennen, 'Near-infrared spectroscopy and imaging for the monitoring of powder blend homogeneity', Journal of Pharmaceutical Sciences, vol. 90, no. 9, pp. 1298–1307, Sep. 2001, doi: 10.1002/jps.1082.
- I. Storme-Paris et al., 'Near InfraRed Spectroscopy homogeneity evaluation of complex powder blends in a small-scale pharmaceutical preformulation process, a real-life application', European Journal of Pharmaceutics and Biopharmaceutics, vol. 72, no. 1, pp. 189–198, May 2009, doi: 10.1016/j.ejpb.2008.11.002.
- C. J. McNeil, M. D. Allen, E. Olympico, J. K. Shoemaker, and C. L. Rice, 'Blood flow and muscle oxygenation during low, moderate, and maximal sustained isometric contractions', American Journal of Physiology-Regulatory, Integrative and Comparative Physiology, vol. 309, no. 5, pp. R475–R481, Sep. 2015, doi: 10.1152/ajpregu.00387.2014.
- A. Feldmann and D. Erlacher, 'Critical oxygenation: Can muscle oxygenation inform us about critical power?', Medical Hypotheses, vol. 150, p. 110575, May 2021, doi: 10.1016/j.mehy.2021.110575.
- S. Ichimura et al., 'Age and Activity Status Affect Muscle Reoxygenation Time after Maximal Cycling Exercise', Medicine & Science in Sports & Exercise, vol. 38, no. 7, pp. 1277–1281, Jul. 2006, doi: 10.1249/01.mss.0000227312.08599.f1.
- A. Hashimoto, 'Applications of Infrared Spectroscopy to Biochemical, Food and Agricultural Process'.
- B. Jamshidi, E. Mohajerani, and J. Jamshidi, 'Developing a Vis/NIR spectroscopic system for fast and non-destructive pesticide residue monitoring in agricultural product', Measurement, vol. 89, pp. 1–6, Jul. 2016, doi: 10.1016/j.measurement.2016.03.069.
- S. Wahab et al., 'Advancement and New Trends in Analysis of Pesticide Residues in Food: A Comprehensive Review', Plants, vol. 11, no. 9, p. 1106, Apr. 2022, doi: 10.3390/plants11091106.
- Y. LeCun, Y. Bengio, and G. Hinton, 'Deep learning', Nature, vol. 521, no. 7553, pp. 436–444, May 2015, doi: 10.1038/nature14539.
- M. O. Okwu and L. K. Tartibu, 'Artificial Neural Network', in Metaheuristic Optimization: Nature-Inspired Algorithms Swarm and Computational Intelligence, Theory and Applications, M. O. Okwu and L. K. Tartibu, Eds., Cham: Springer International Publishing, 2021, pp. 133–145. doi: 10.1007/978-3-030-61111-8_14.
- J. Walsh, A. Neupane, A. Koirala, M. Li, and N. Anderson, 'Review: The evolution of chemometrics coupled with near infrared spectroscopy for fruit quality evaluation. II. The rise of convolutional neural networks', Journal of Near Infrared Spectroscopy, vol. 31, no. 3, pp. 109–125, Jun. 2023, doi: 10.1177/09670335231173140.
- K. O'Shea and R. Nash, 'An Introduction to Convolutional Neural Networks'. arXiv, Dec. 02, 2015. Accessed: May 01, 2024. [Online]. Available: http://arxiv.org/abs/1511.08458
- 'NN SVG'. Accessed: Jun. 05, 2024. [Online]. Available: https://alexlenail.me/NN-SVG/LeNet.html
- A. Rohila, A. Duhan, D. Maan, A. Kumar, and K. Kumar, 'Impact of agricultural practices on environment', Asian Journal of Microbiology, Biotechnology and Environmental Sciences, vol. 19, pp. 381–384, Jun. 2017.
- J. W. Palmer, F. R. Harker, D. S. Tustin, and J. Johnston, 'Fruit dry matter concentration: a new quality metric for apples', Journal of the Science of Food and Agriculture, vol. 90, no. 15, pp. 2586–2594, 2010, doi: 10.1002/jsfa.4125.
- 'Why am I seeing a negative R^2 value?', Desmos Help Center. Accessed: Jun. 06, 2024. [Online]. Available: https://help.desmos.com/hc/en-us/articles/202529139-Why-am-I-seeing-a-negative-R-2-value
- 'DeepLearning_for_VIS-NIR_Spectra/notebooks/Deep-Tuttifrutti_I at master · dario-passos/DeepLearning_for_VIS-NIR_Spectra · GitHub'. Accessed: Jun. 06, 2024. [Online]. Available: https://github.com/dario-passos/DeepLearning_for_VIS-NIR_Spectra/tree/master/notebooks/Deep-Tuttifrutti_I
- D. Passos and P. Mishra, 'A tutorial on automatic hyperparameter tuning of deep spectral modelling for regression and classification tasks', Chemometrics and Intelligent Laboratory Systems, vol. 223, p. 104520, Apr. 2022, doi: 10.1016/j.chemolab.2022.104520.